Gojek · GoFood · June–October 2023
Redesigning the order tracking experience to reduce customer anxiety
In 2023, Gojek needed to improve profitability by reducing rewards and promotion costs while keeping food delivery affordable for Indonesian customers. To support this, order pooling was introduced but faced low customer adoption. As Design Lead for the consumer booking experience, I built and led a team to redesign the order tracking experience, reducing customer anxiety and enabling the scalability of this new logistics model.
My Role
Product Design Lead
Team
1 Product Designer, 1 Motion Designer, 1 UX Writer
Duration
5 months (Jun–Oct 2023)
Market
Indonesia (Nationwide)
Business shipped a new delivery model without touching the UX.
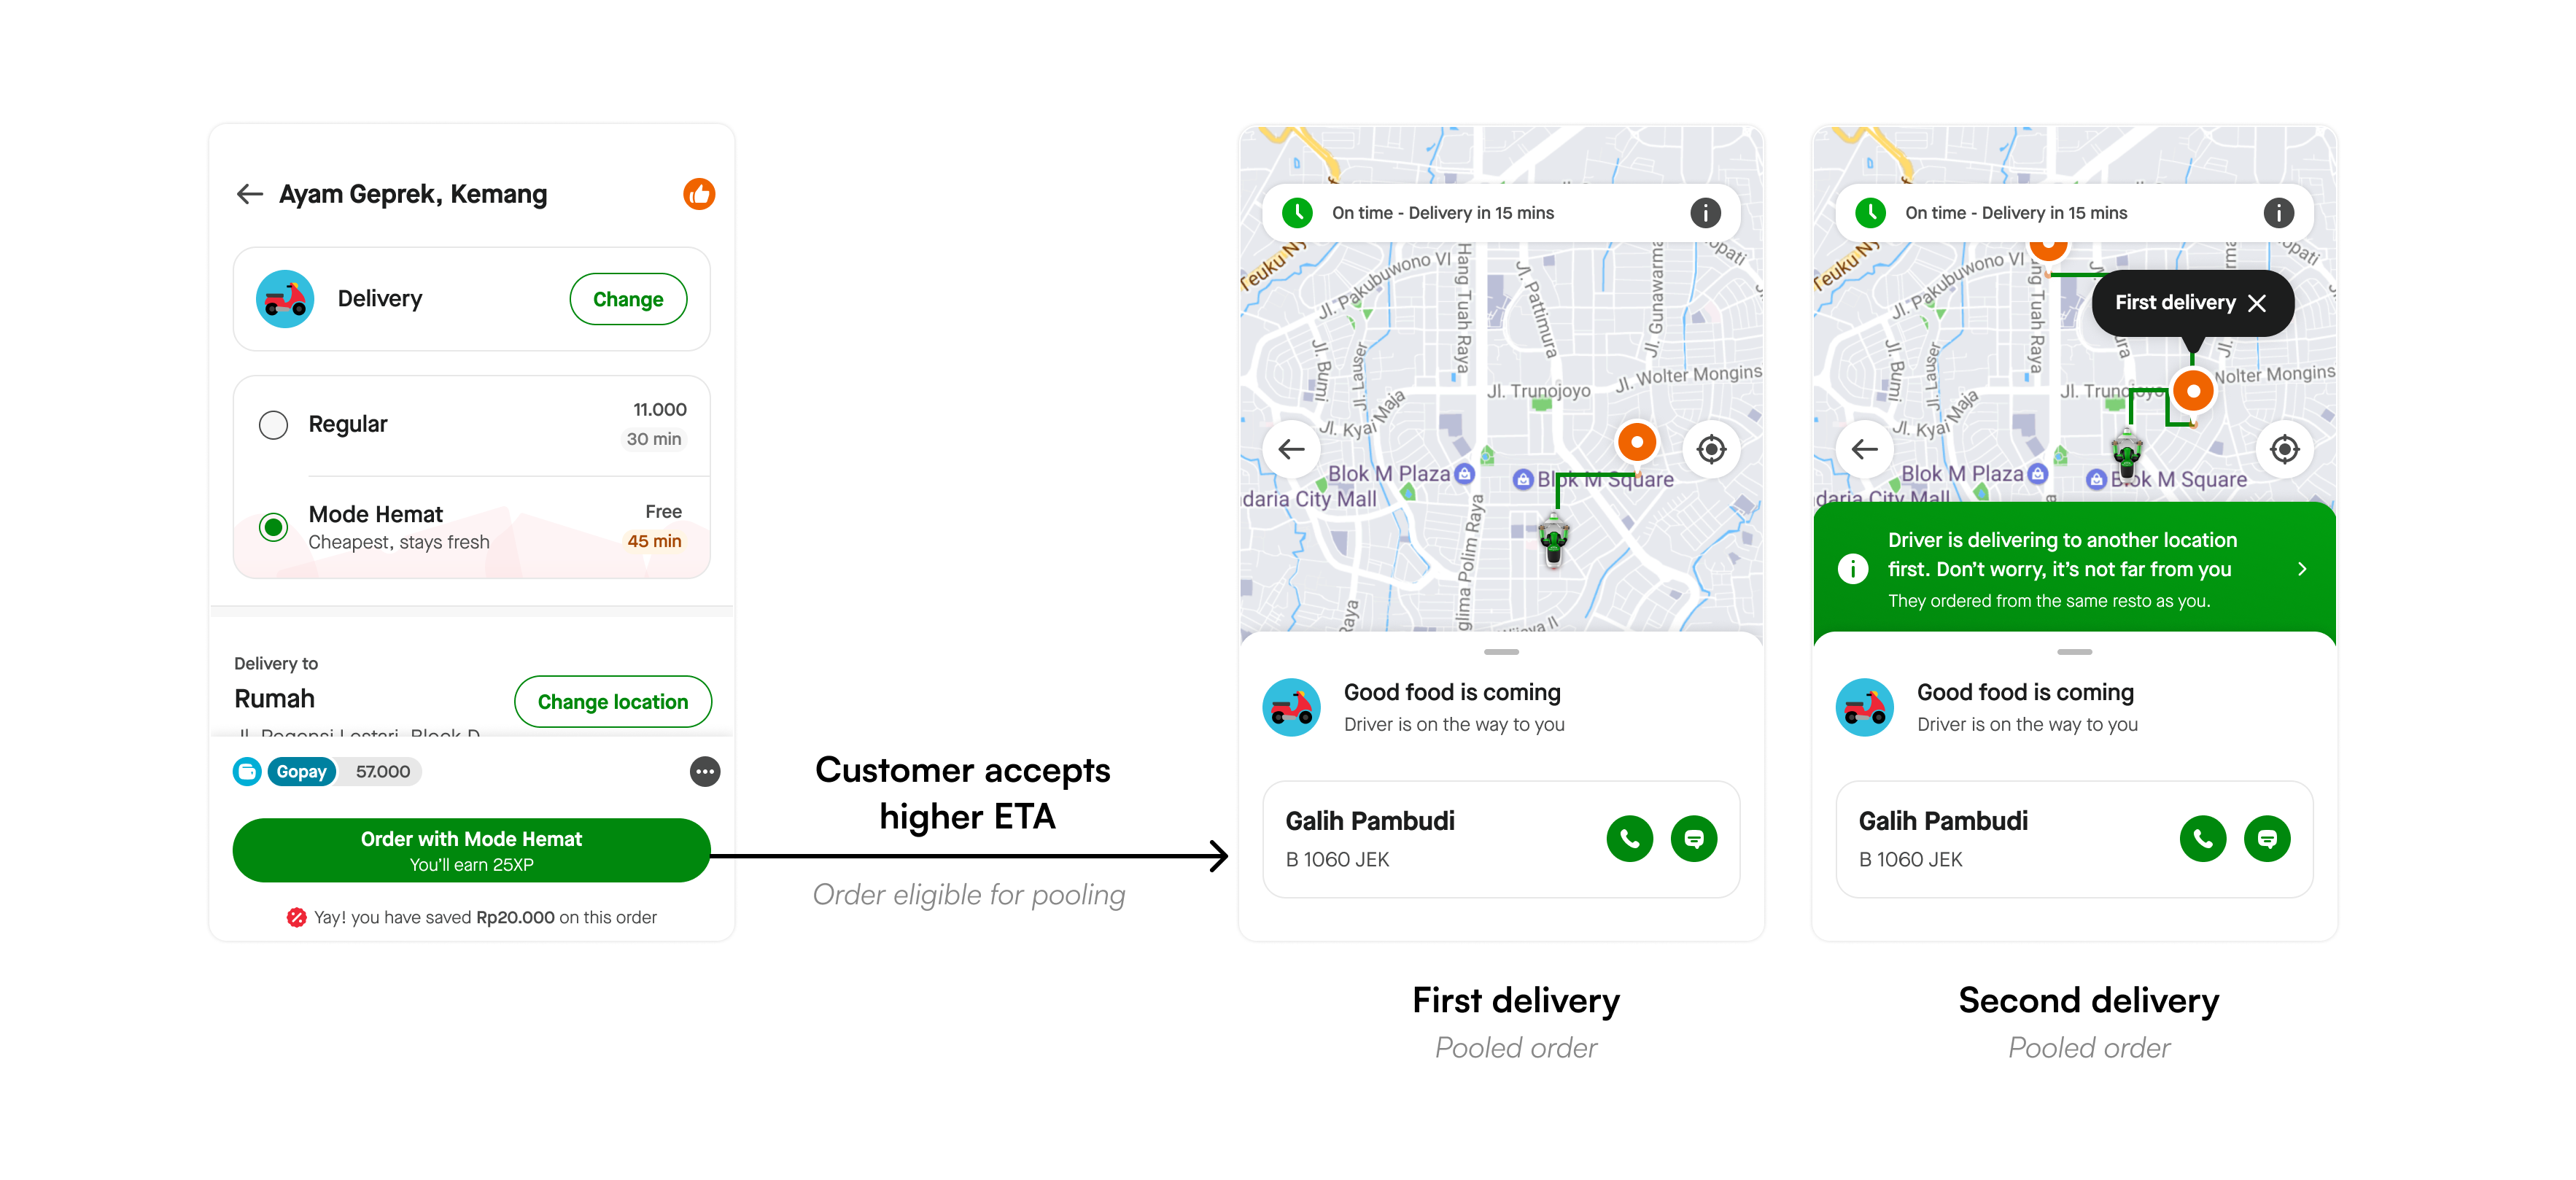
In 2023, Gojek was under pressure to become profitable. For GoFood, the lever was clear: lower the delivery fee. Order pooling, “Mode Hemat”, was introduced as the solution. Customers accept a slightly higher ETA; eligible orders get assigned to a single driver; logistics savings get passed on as subsidies.
The business ran an experiment. Orders started pooling. And the tracking screen that millions of users stared at while waiting for their food stayed exactly as it was: a map-first UI designed for regular, single-order deliveries.
It didn't go well.
Order delay & driver complaint tickets
For pooled orders vs. regular orders on identical routes
ETA compliance for second deliveries
Down from baseline, eroding the one promise users were relying on
Potential revenue loss per month
As pooling was scaled back 40% to contain the complaint surge
Pooling exposed structural limitations in the tracking experience
Beyond pooling, the tracking screen had deeper structural issues that would have broken any high-ETA, multi-state delivery model. We audited the current experience and found four root causes.
Linear order lifecycle
The tracking experience assumed a fixed sequence of events. As logistics evolved to support pooling and new fulfillment models, order preparation and driver assignment could happen in parallel, making the existing state model inadequate.
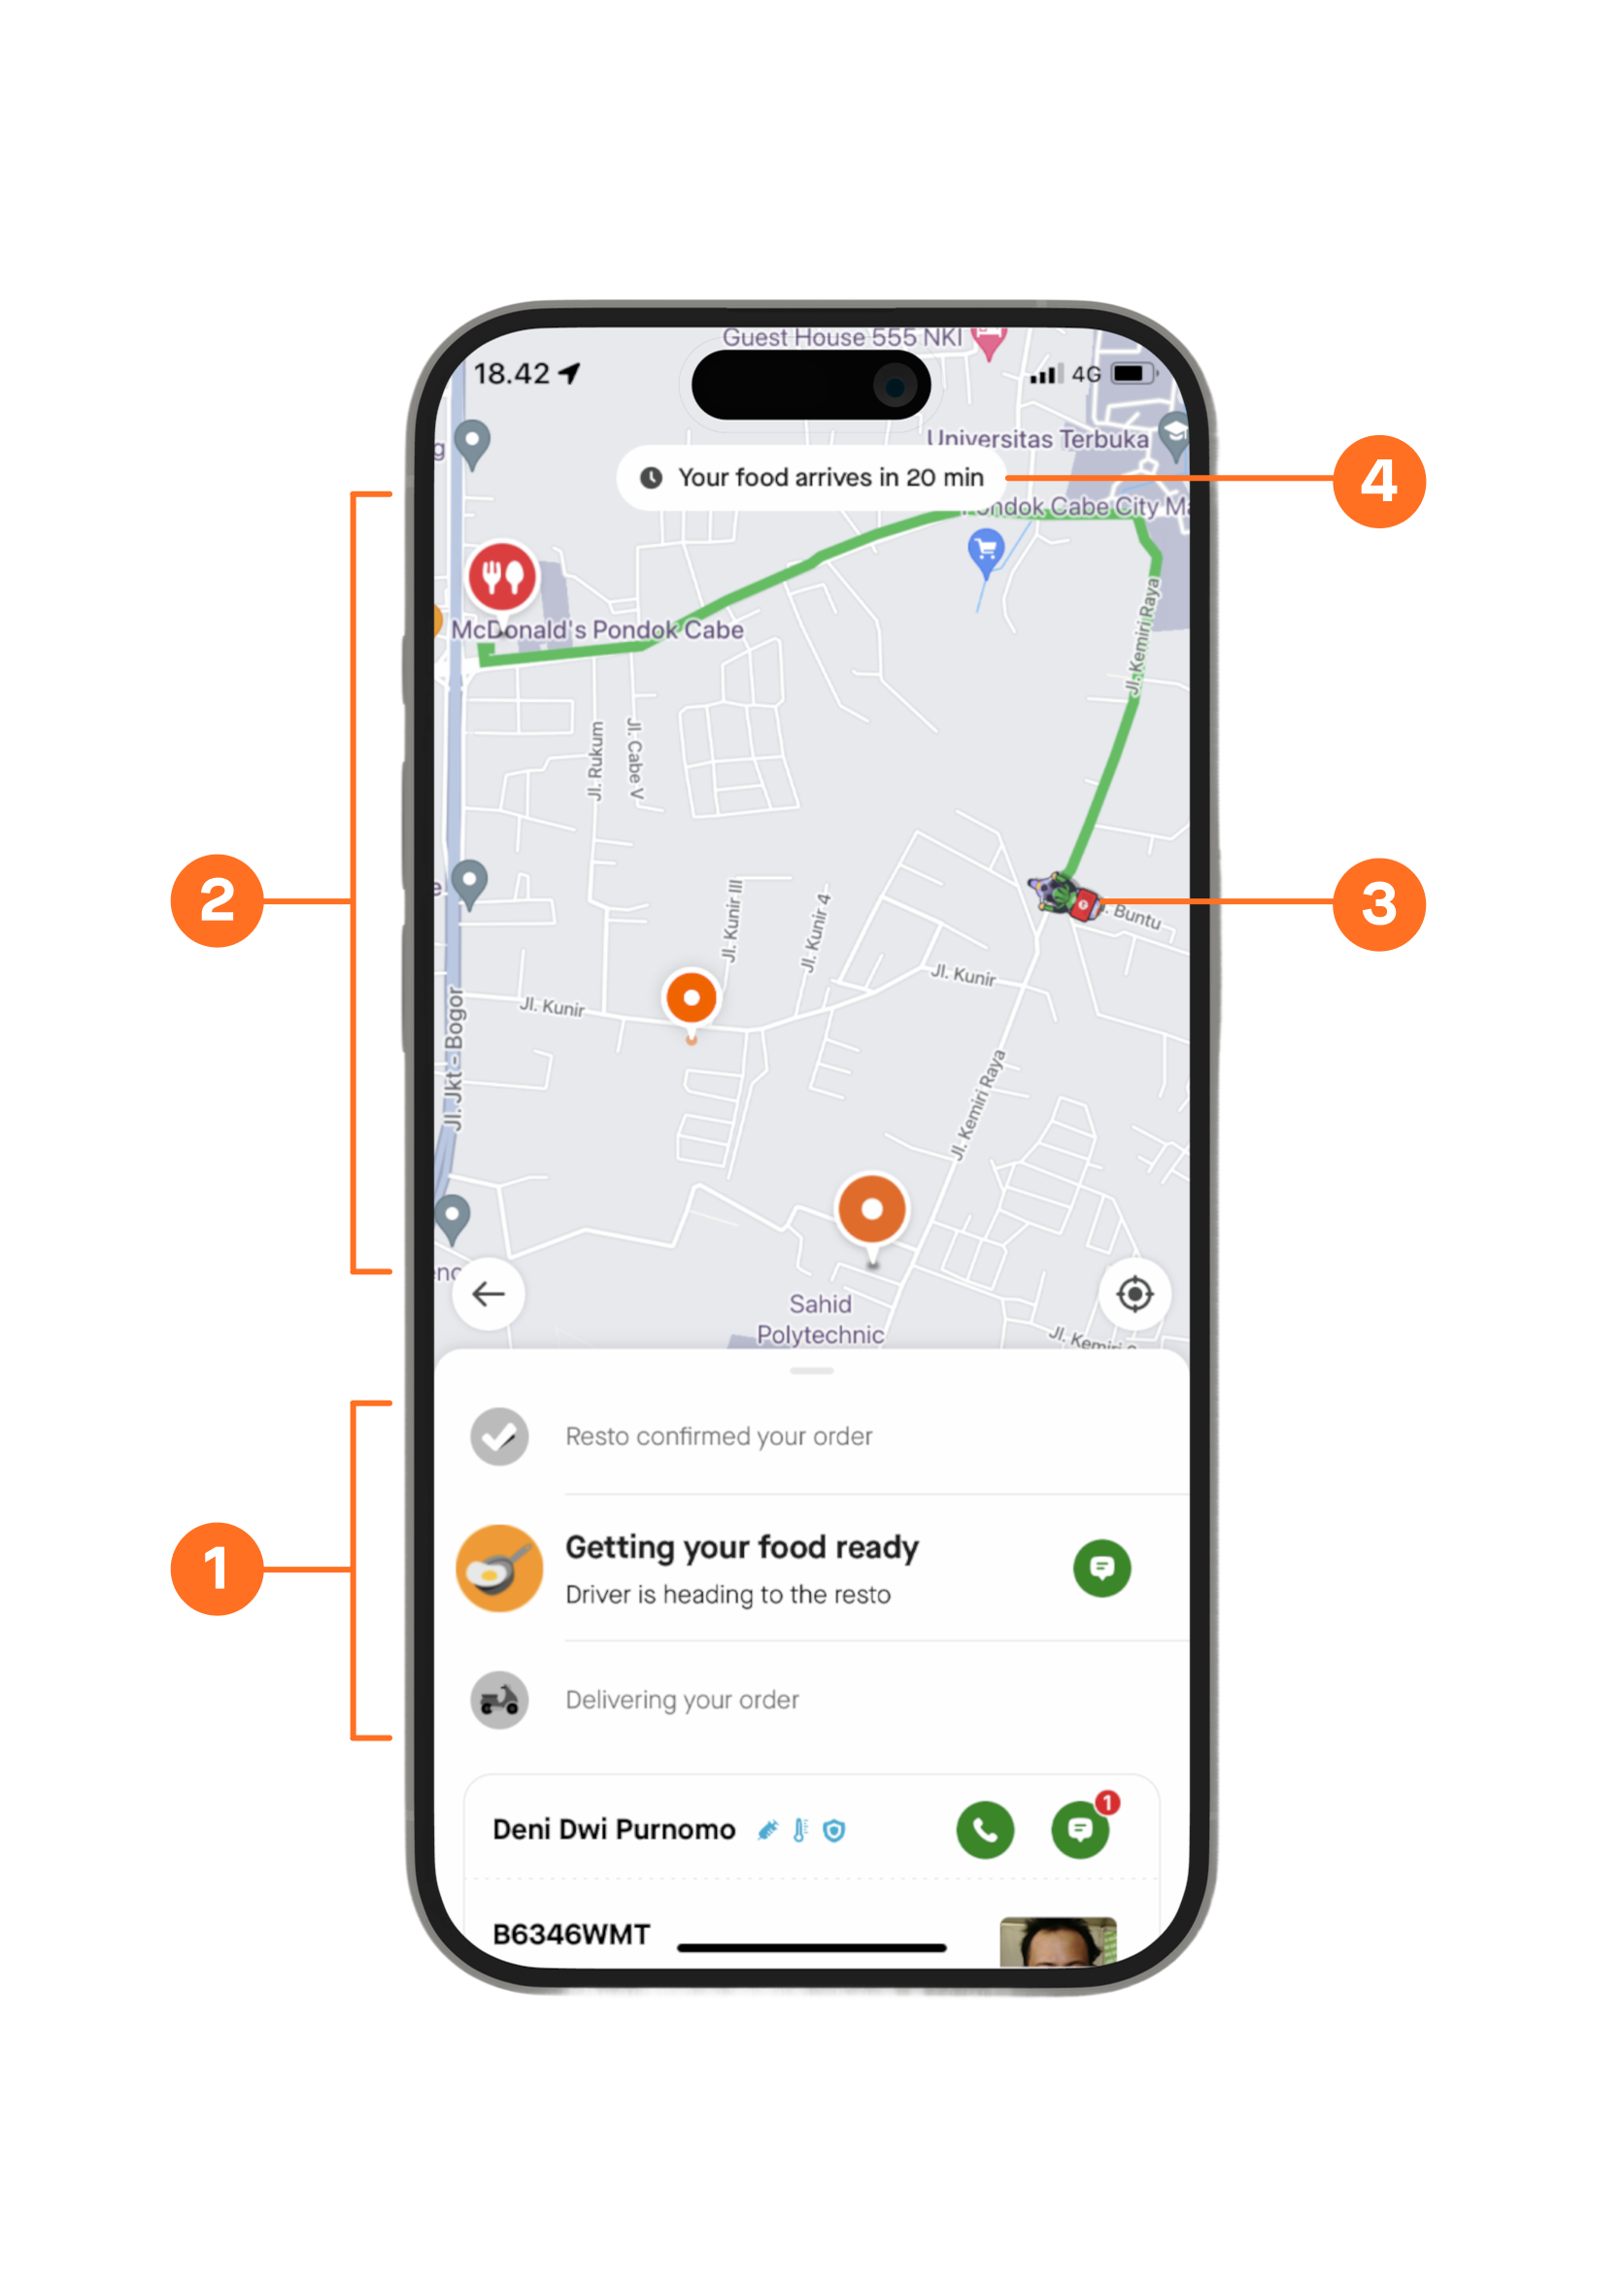
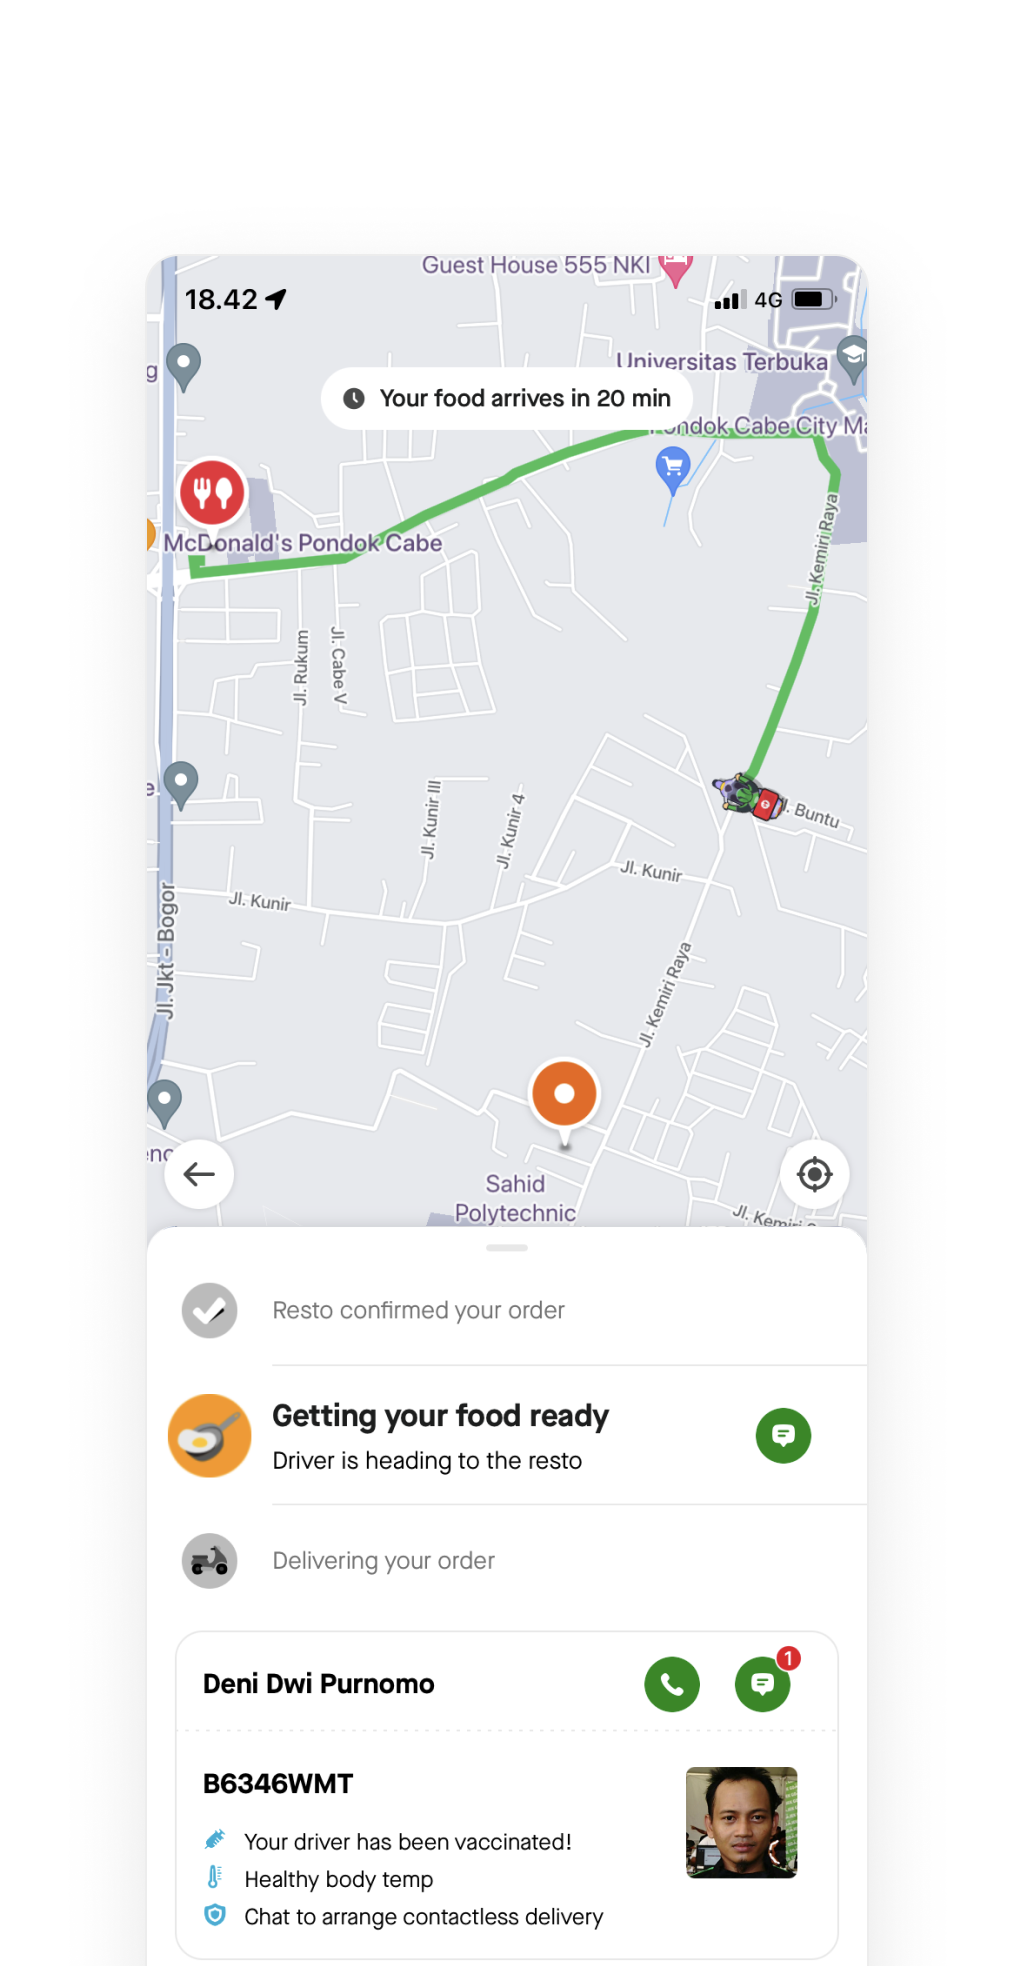
Map dominates the experience
The map occupied most of the screen despite providing little value before a driver was assigned or en route. It also increased operational costs through frequent map API calls.
Excessive focus on driver movement
Customers closely associated driver activity with order progress. Delayed driver assignment, stationary drivers, route changes, or location inaccuracies often created uncertainty and led to unnecessary cancellations and support requests.
ETA lacks prominence
The promised delivery time had low visual priority and was easy to miss. Combined with historically inconsistent ETA accuracy, this reduced customer trust in the delivery promise.
HMW
How might we balance system status transparency with customer anxiety?
HMW
How might we design to change the mental model of customers to adapt the new logistics model?
Success Metrics
We identified three behavioral proxies, each representing a distinct way customers respond to uncertainty while waiting for their orders.
Time spent on tracking screen
Anxious customers keep the app open and closely monitor their order. Less time spent tracking indicates greater confidence and clarity.
Tracking screen open rate
Repeatedly checking the tracking screen signals uncertainty. A lower open rate suggests higher trust in delivery updates.
Late complaint tickets
Support tickets raised during an active delivery are a strong signal of customer anxiety. Fewer tickets indicate the experience is effectively addressing customer concerns.
A deliberate, iterative approach
Two targeted experiments ran before the full redesign, each with a specific hypothesis, a measurable outcome, and a deliberate learning that shaped what came next.
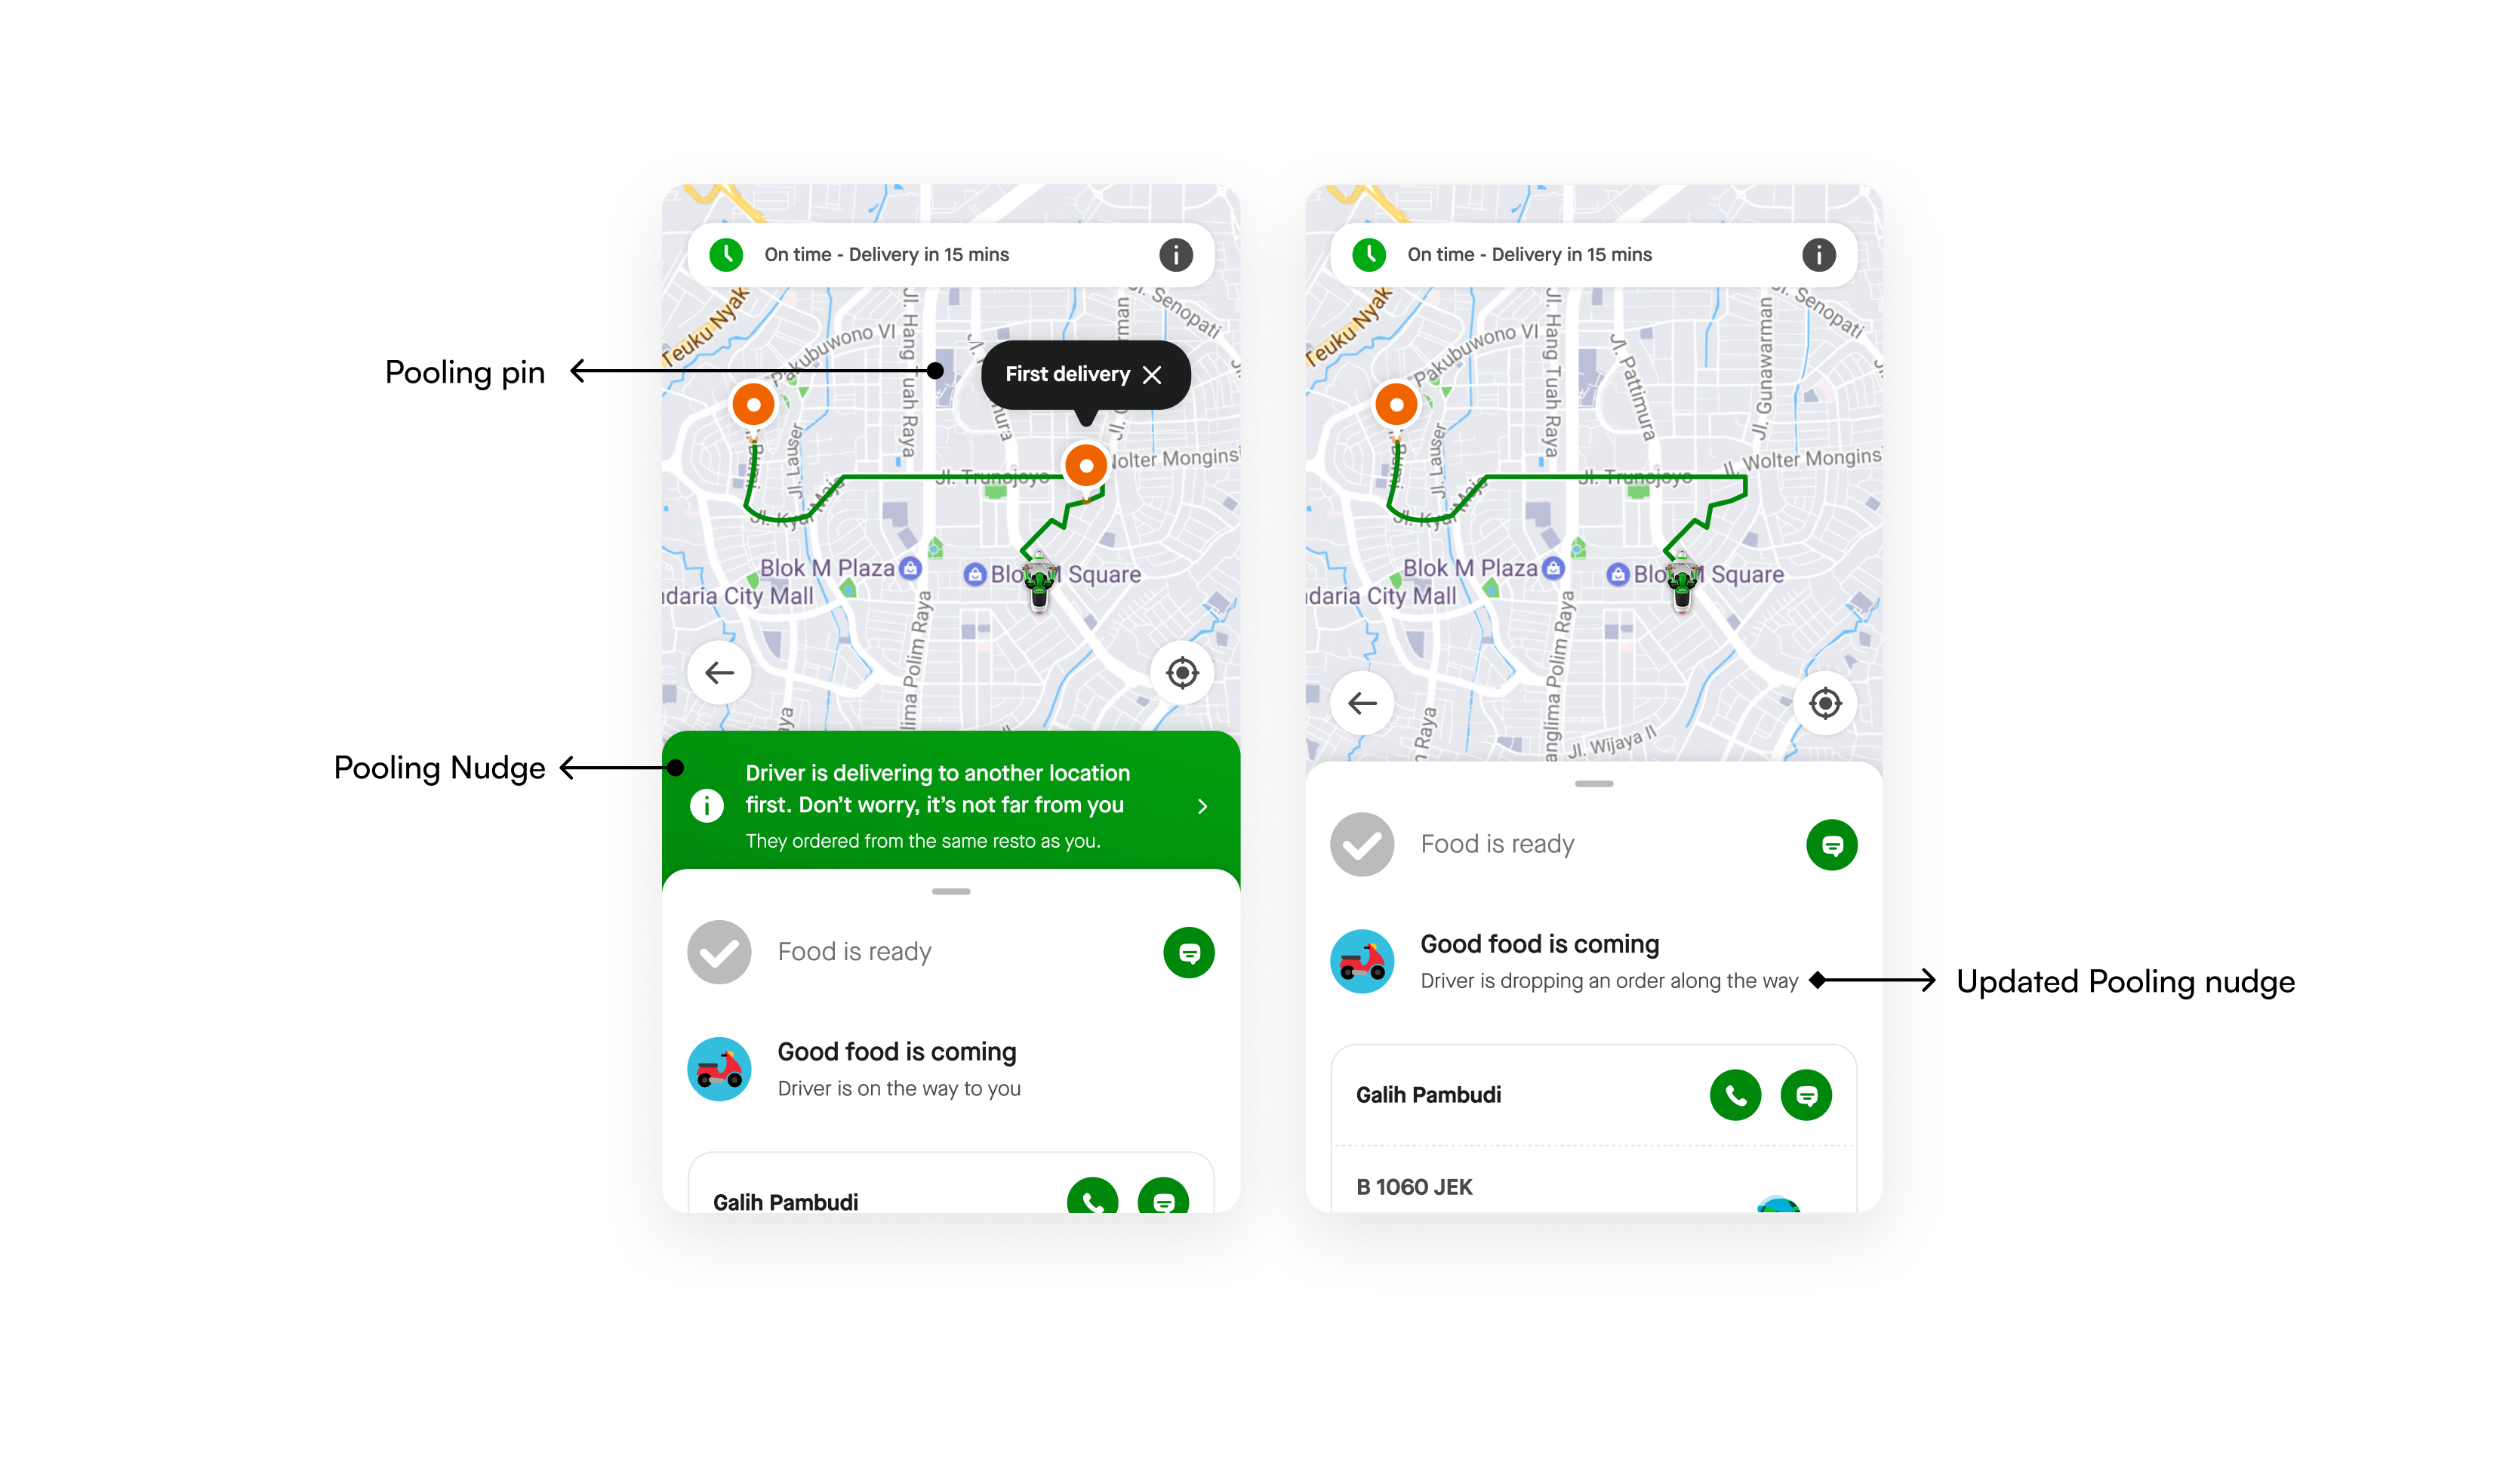
Over-communicating pooling reinforced perceptions of delay. Surfacing pooling information contextually rather than persistently would reduce anxiety and keep attention on the ETA promise.
Remove 2nd customer pooling pin, show only 1 pin on the map
Remove the banner nudge that explained the pooling model
Surface pooling context as part of the order status copy instead
No statistically significant impact, positive or negative, on any anxiety metric. No changes to driver↔customer chat initiations.
Over-communicating about pooling doesn't add anxiety. The problem isn't the labels, it's the underlying UI. The map and the state model are the root issue, not the pooling messaging.
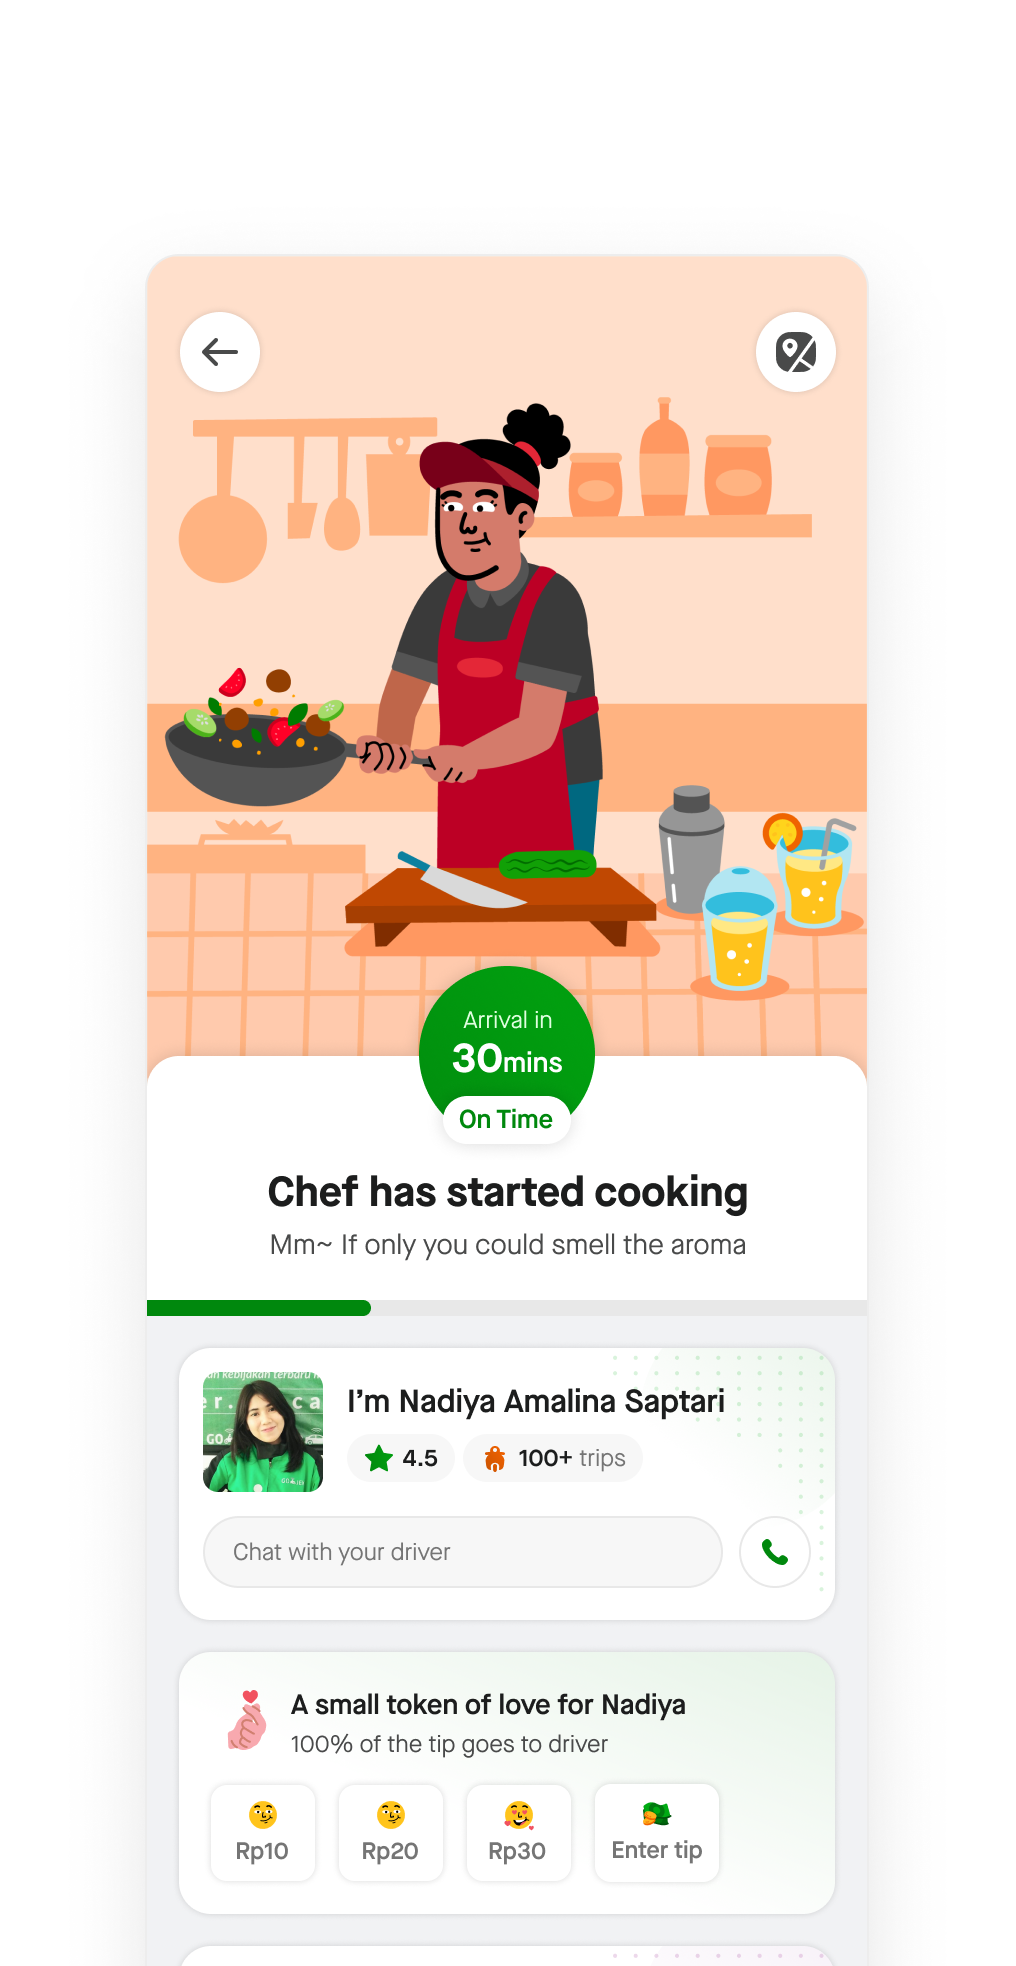
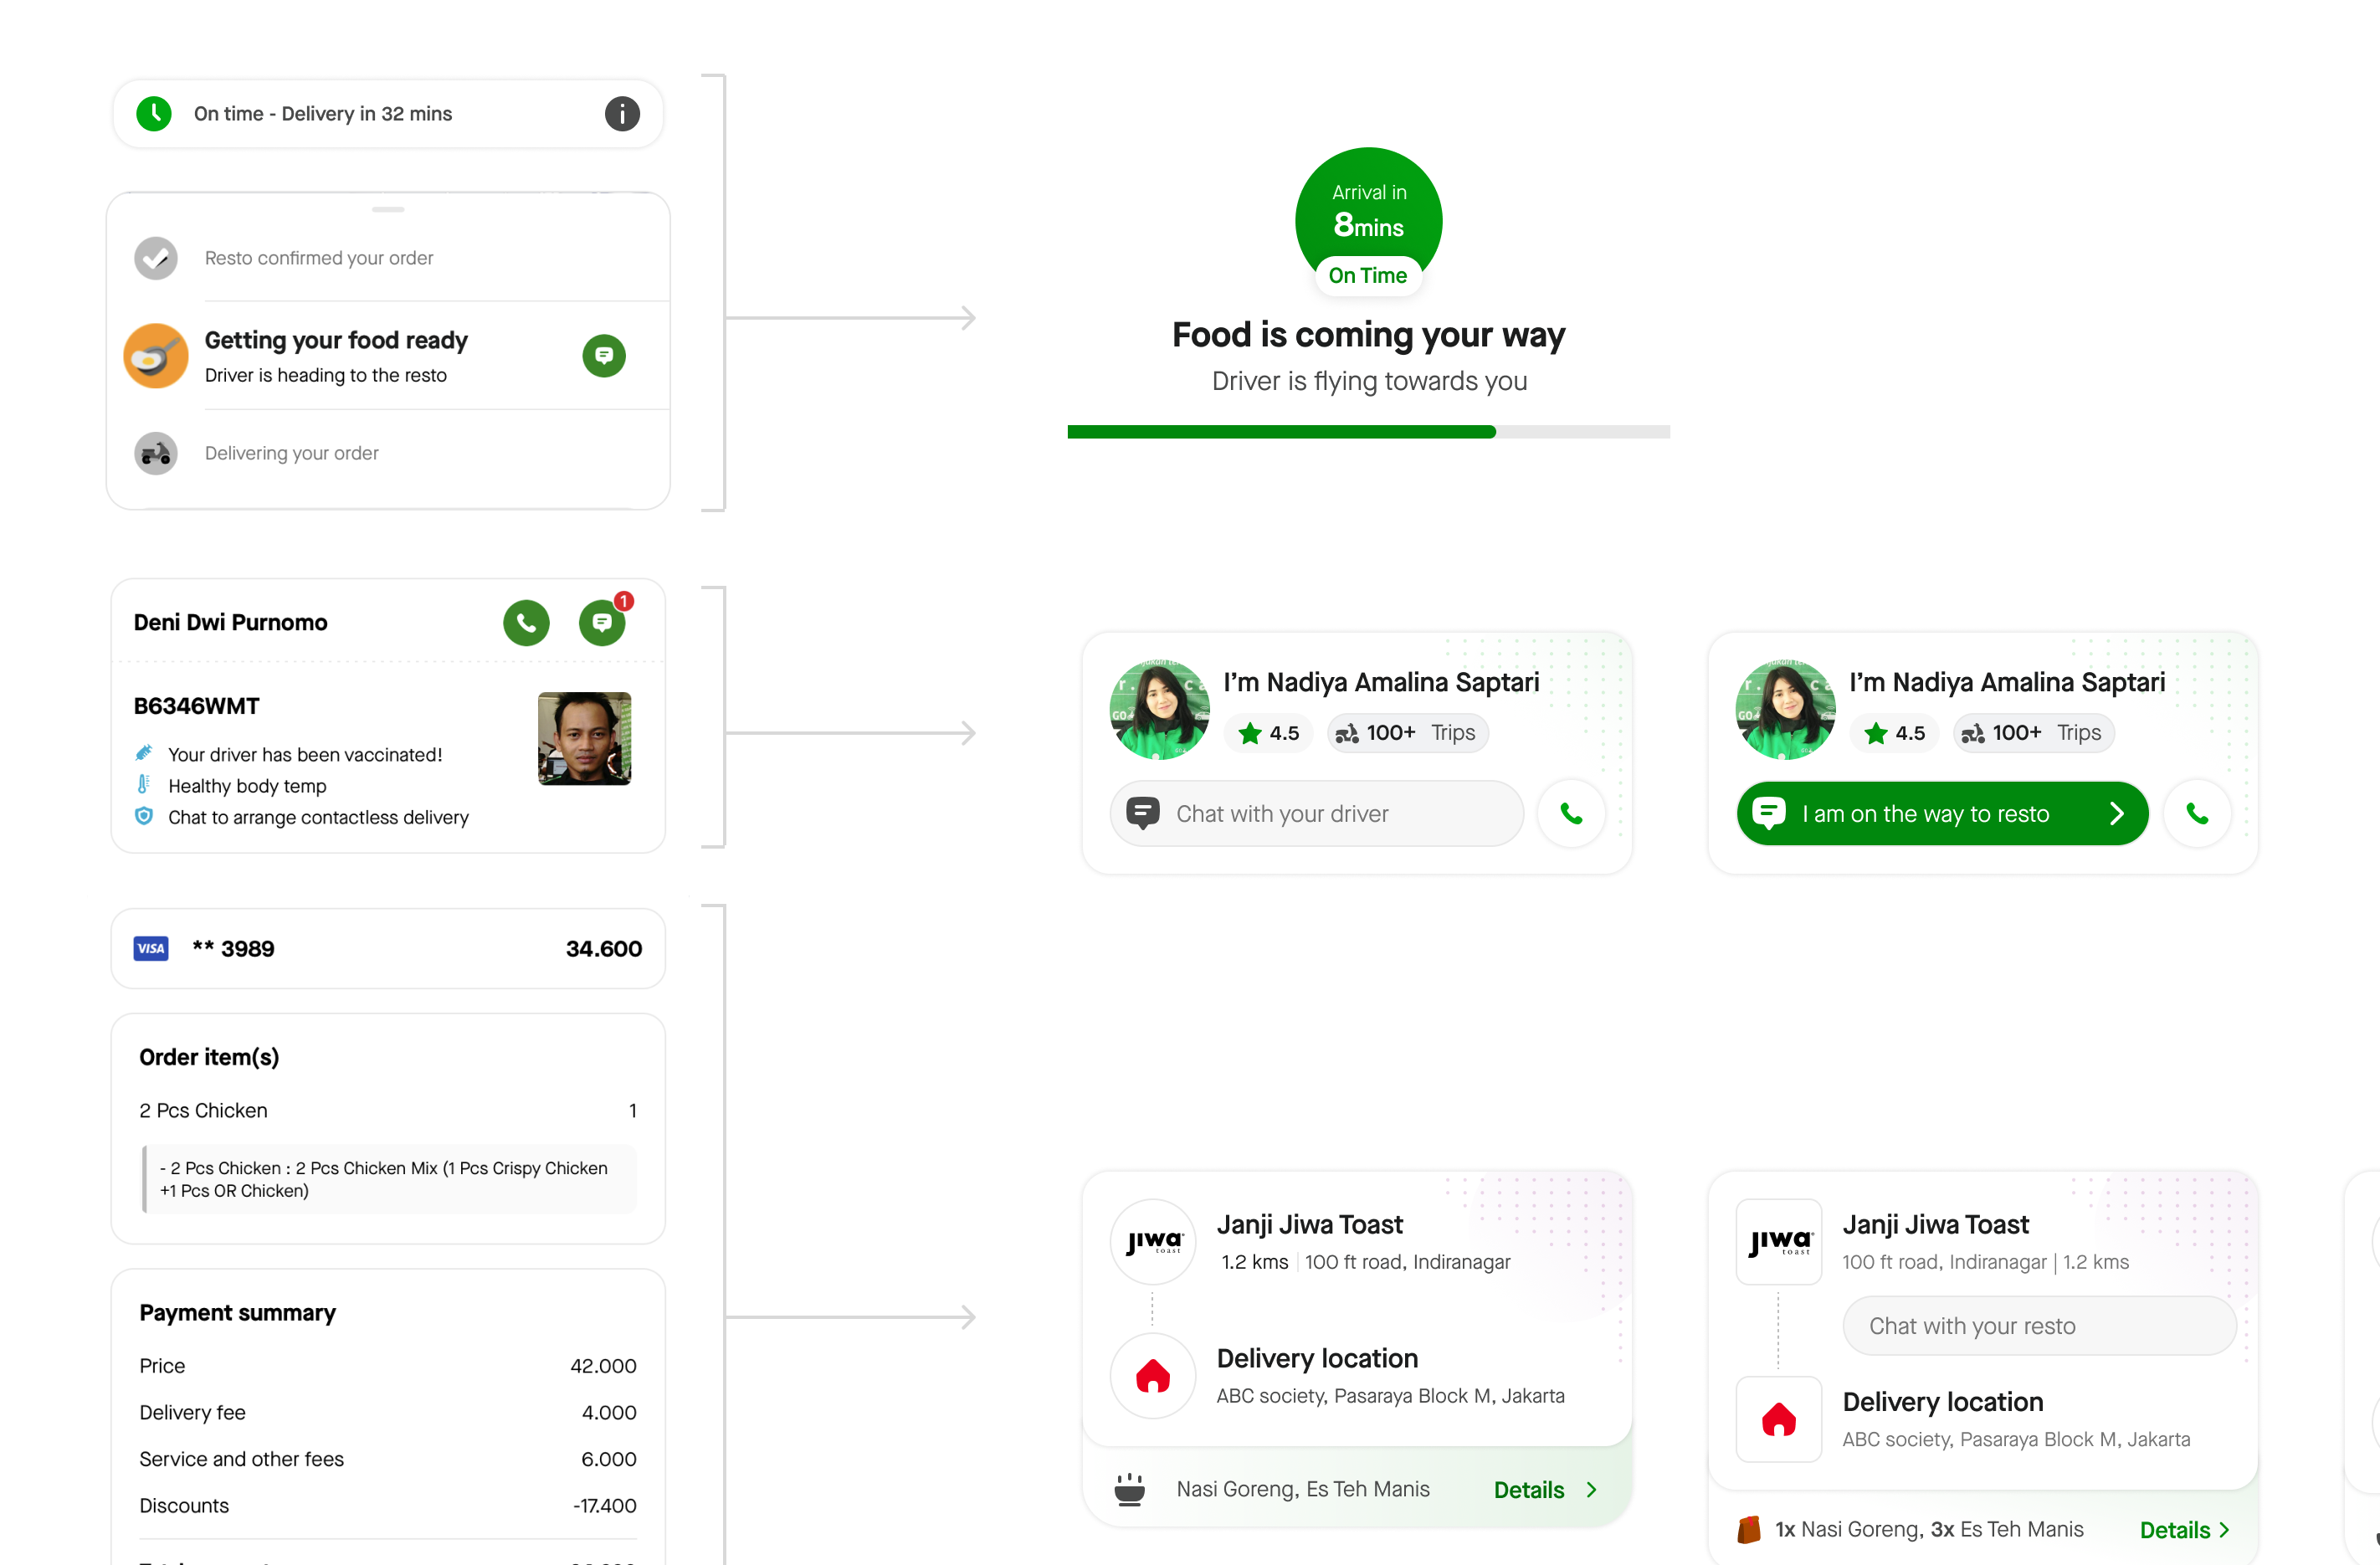
ETA-first. Illustration-driven. State-rich.
Four design principles, derived from what the experiments proved. Shipped in October 2023.
ETA focused
The arrival countdown becomes the dominant UI element: a large, prominent circle with time and on-time status. The map now supports the ETA, not the other way around. Users are anchored to time, not location.
Scalable states
New order state model that decouples food preparation, driver assignment, and delivery. Non-sequential pooling logistics are now fully representable, with each state having its own distinct visual treatment and copy.
Delightful journey
State-specific illustrations replace the map during food preparation and pickup phases. A chef cooking, a driver flying. Contextual, emotionally resonant, and animated to signal progress without GPS dependency.
Cleaner UI
The three most common support queries ('When will I get a driver?', cancellation, order edits) are surfaced as quick actions directly on the tracking screen. Reducing contact rate and friction simultaneously.
The numbers that followed.
After Experiment 2
After Experiment 3
The redesign unlocked the rollout of the new pooling model, reducing late-delivery tickets and creating a more predictable, delightful tracking experience. The solution later became the blueprint for order tracking across other products like GoMart.